How to Use AI to Create Infographics for Free (Boost Your LinkedIn Engagement Today!)
In today’s digital landscape, visual content reigns supreme. Have you ever scrolled through LinkedIn and stopped at an eye-catching infographic that perfectly summarized a complex concept in seconds? Those professional-looking graphics aren’t just reserved for design experts anymore. Thanks to AI-powered tools, anyone can create scroll-stopping infographics without spending a dime.
In this comprehensive guide, I’ll walk you through the exact process of creating compelling infographics using an AI tool called Piktochart. These infographics can help you establish authority, increase engagement, and stand out on LinkedIn’s crowded feed – all without needing any design skills!
Why Infographics Matter for LinkedIn Engagement
Before diving into the how-to, let’s quickly understand why infographics are so powerful for LinkedIn:
- Information Retention: People remember 65% of information when paired with relevant images compared to just 10% with text alone
- Higher Engagement: Posts with visual elements receive 94% more views than text-only content
- Improved Shareability: Visual content is 40x more likely to get shared on social media
- Professional Branding: Well-designed infographics position you as an industry expert
Now, let’s get into the step-by-step process of creating these engagement magnets for free!
Step 1: Access the Piktochart Website
First things first, you need to visit the Piktochart website. It’s one of the most user-friendly AI-powered graphic design platforms available today.
Simply open your browser and type “Piktochart” in the search bar, or directly navigate to their website. The clean interface welcomes you with various design options including infographics, presentations, posters, and more.
Step 2: Create Your Free Account
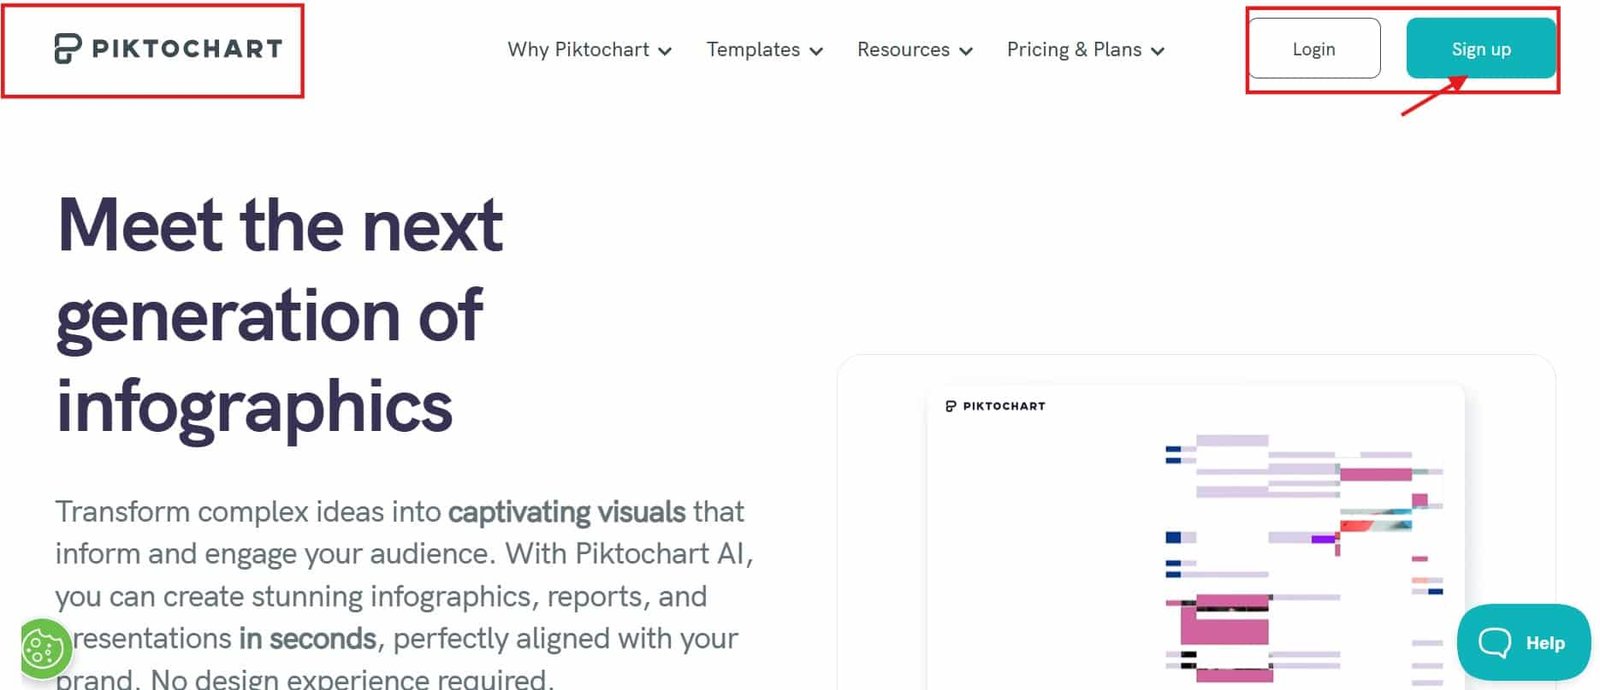
To unlock Piktochart’s features, you’ll need to create an account. Don’t worry – this is completely free and only takes a minute.
Click on the prominent “Sign Up” button in the top-right corner of the homepage. You’ll be presented with different options for account creation.
For the quickest setup, choose the “Continue with Google” option and select your preferred Google account. This saves you from remembering yet another password! If you prefer, you can also sign up using your email address.
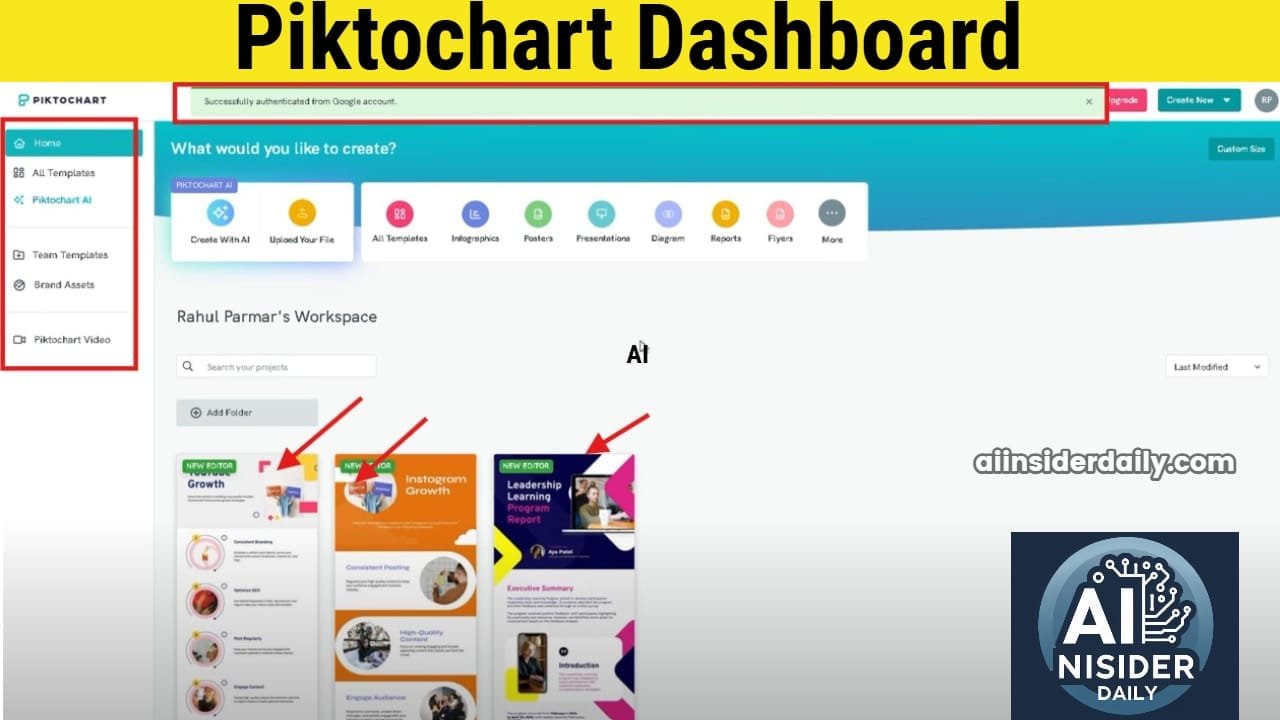
Step 3: Explore the Piktochart Dashboard
Once logged in, you’ll land on the Piktochart dashboard. Take a moment to familiarize yourself with the interface – it’s quite intuitive even for beginners.
The dashboard displays several design categories:
- Infographics
- Presentations
- Posters
- Reports
- Flyers
- And more
Since we’re focusing on infographics for LinkedIn, look for the “Infographics” option and click on it.
Step 4: Choose Between Templates or AI Generation
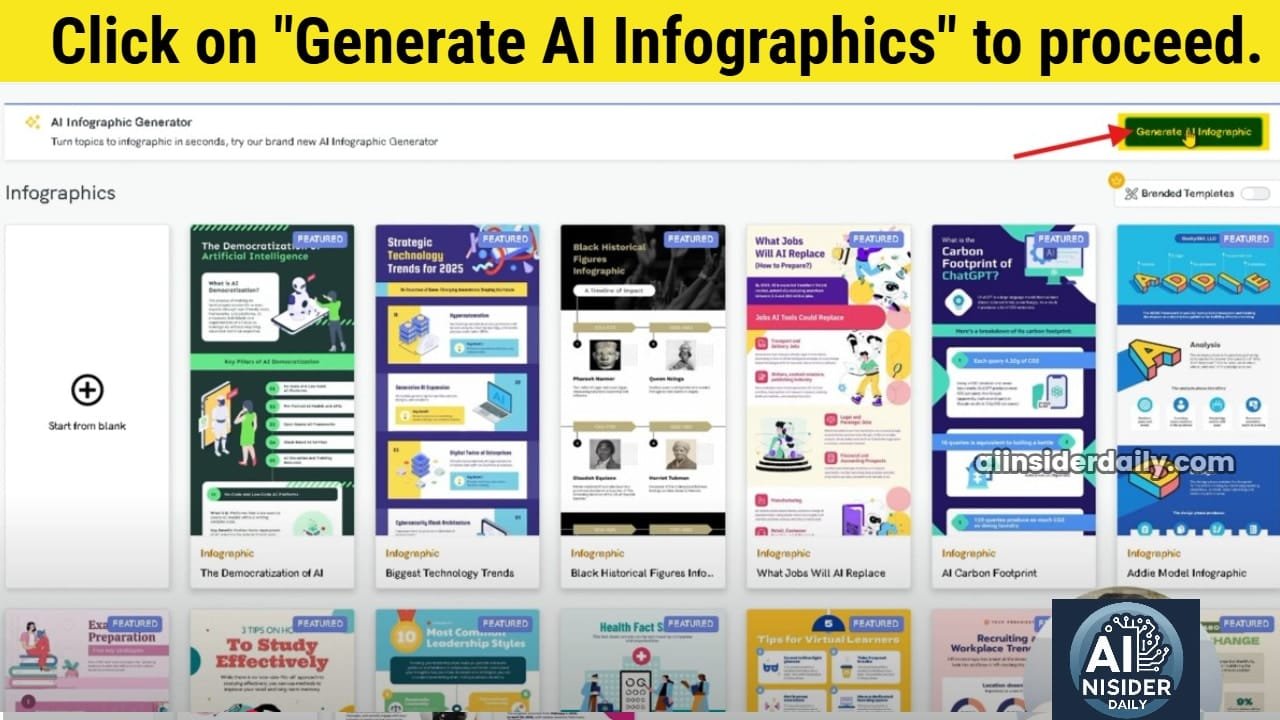
After selecting the infographics option, you’ll notice Piktochart offers two main approaches:
- Using pre-made templates: Browse through dozens of professionally designed templates that you can customize
- AI-generated infographics: Let artificial intelligence create an infographic based on your topic or content
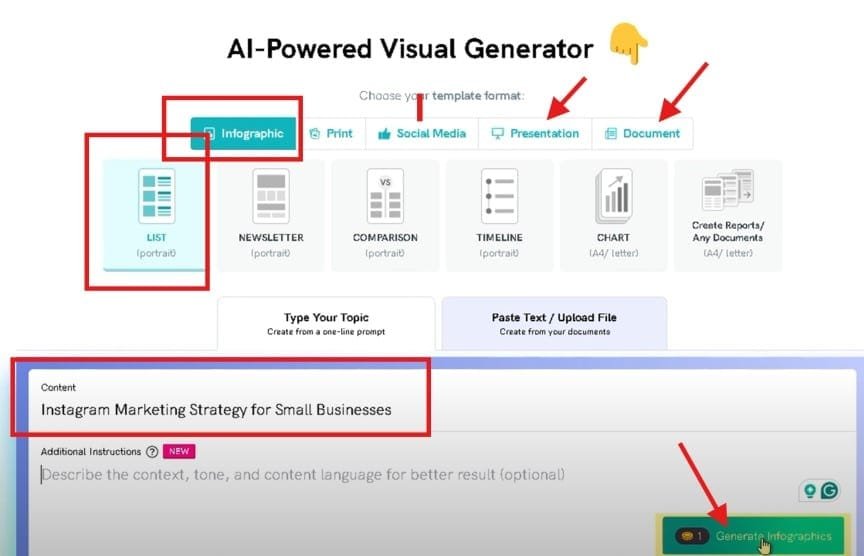
For the most efficient and impressive results, let’s focus on the AI generation option. Click on “Generate AI Infographics” to proceed.
Step 5: Select Your Format
Once you click on AI generation, you’ll be asked to choose a format. Piktochart offers various formats suitable for different purposes:
- Social media
- Presentation
- Documents
Since our goal is to create infographics for LinkedIn, select the “Infographics” option. This ensures your design will be optimized for social sharing with appropriate dimensions and layout.
Step 6: Choose Your Infographic Style
Now comes the fun part – selecting the visual style for your infographic. Piktochart will present several style options that determine the overall look and feel of your design.
Take your time browsing through these styles, as they significantly impact how your information is presented. Consider your brand identity and the message you want to convey when making this choice.
Select a style that resonates with your personal or company brand for consistency across your LinkedIn content.
Step 7: Input Your Content (Two Options)
At this stage, Piktochart presents you with two ways to create your infographic:
Option A: Generate from a Topic
If you have a general topic in mind but haven’t written specific content, this is your best choice.
- Click on “Type your topic”
- In the text field, enter a specific and clear topic. For example: “Instagram Marketing Strategy for Small Businesses”
- (Optional) Provide additional instructions to guide the AI. For instance: “Focus on budget-friendly tactics” or “Include statistics from 2024”
Option B: Generate from Your Content
If you already have written content that you want transformed into an infographic:
- Click on “Paste text or upload file”
- Copy and paste your pre-written content into the box
- (Optional) Add specific instructions about how you want the content structured
Both options work extremely well, but using your own content gives you more control over the specific information included.
Step 8: Generate Your Infographic
Once you’ve entered your topic or pasted your content, click the “Generate Infographic” button.
The AI will now work its magic! This typically takes about 20-30 seconds depending on the complexity of your topic and the length of your content.
During this time, Piktochart’s AI is:
- Analyzing your content for key points
- Selecting appropriate visuals
- Organizing information logically
- Creating a cohesive design based on your chosen style
Be patient – the results are worth the short wait!
Step 9: Review and Save Your Generated Infographic
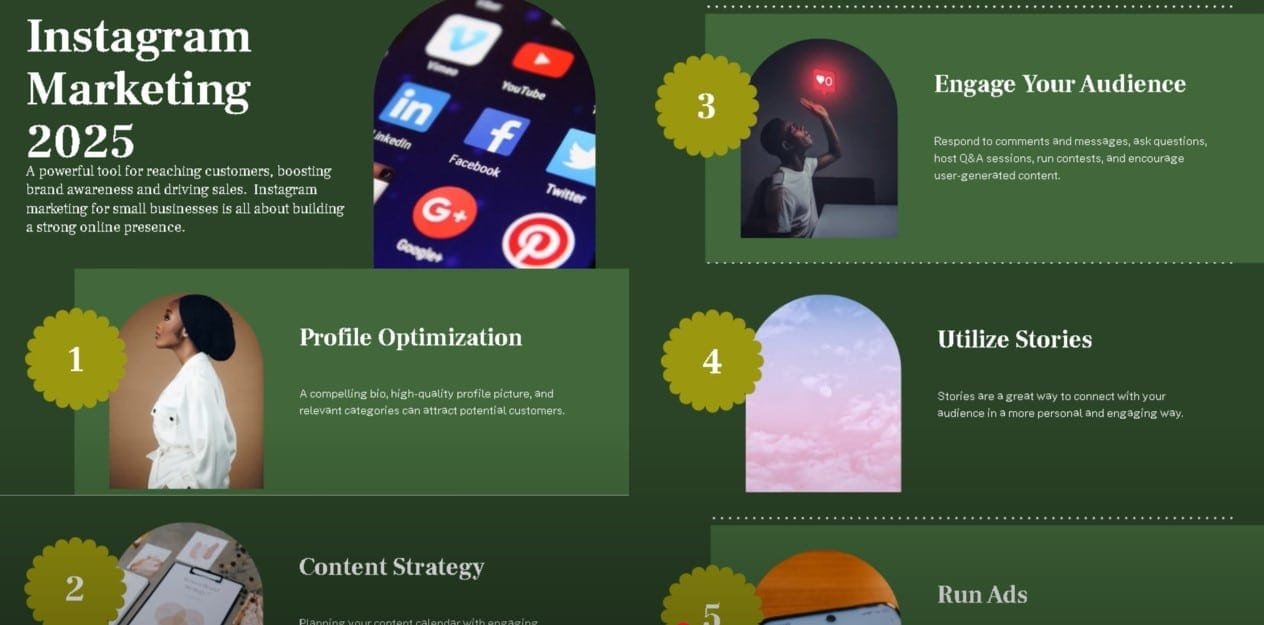
Voilà! Your AI-generated infographic is now ready for review. Take a moment to examine what the AI has created.
You’ll likely be impressed with how well it’s organized your information and created a visually appealing layout. At this point, you have two options:
- If you’re completely satisfied, you can proceed to download
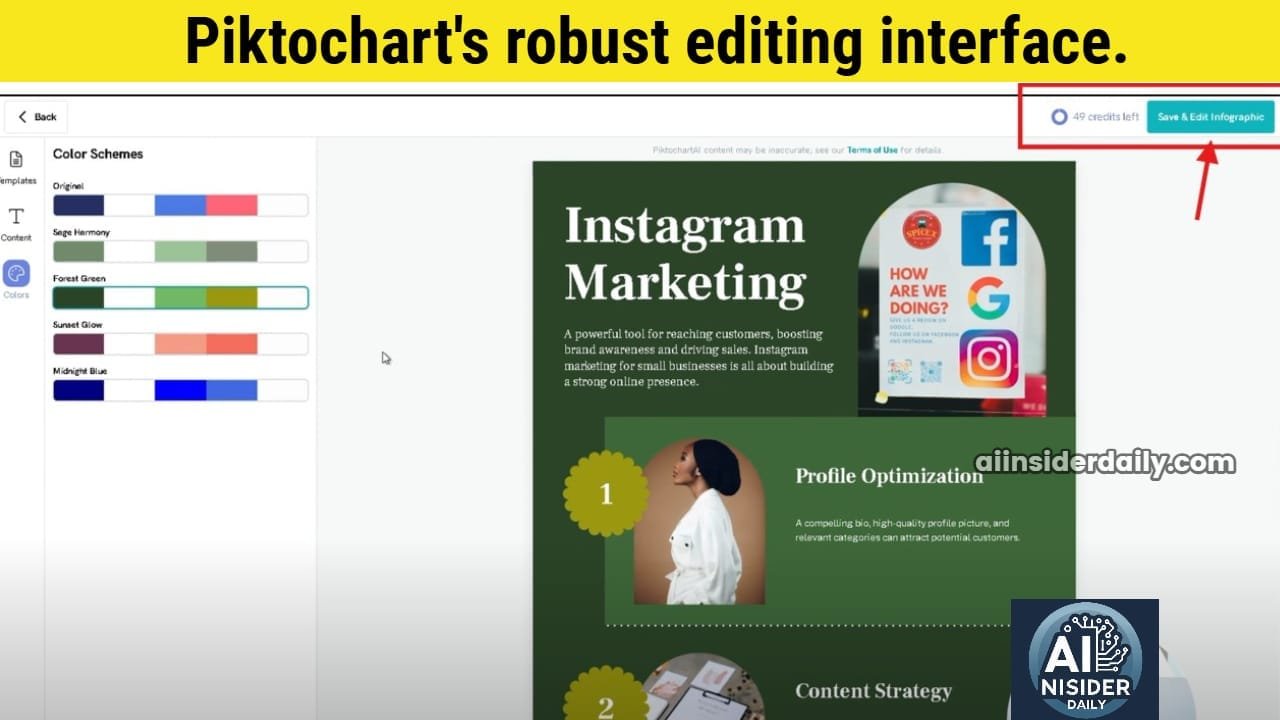
- If you want to make adjustments (which I recommend), click on “Save and Edit”
For most professional purposes, I suggest making at least some minor customizations to ensure the infographic perfectly represents your brand and message.
Step 10: Customize Your Infographic
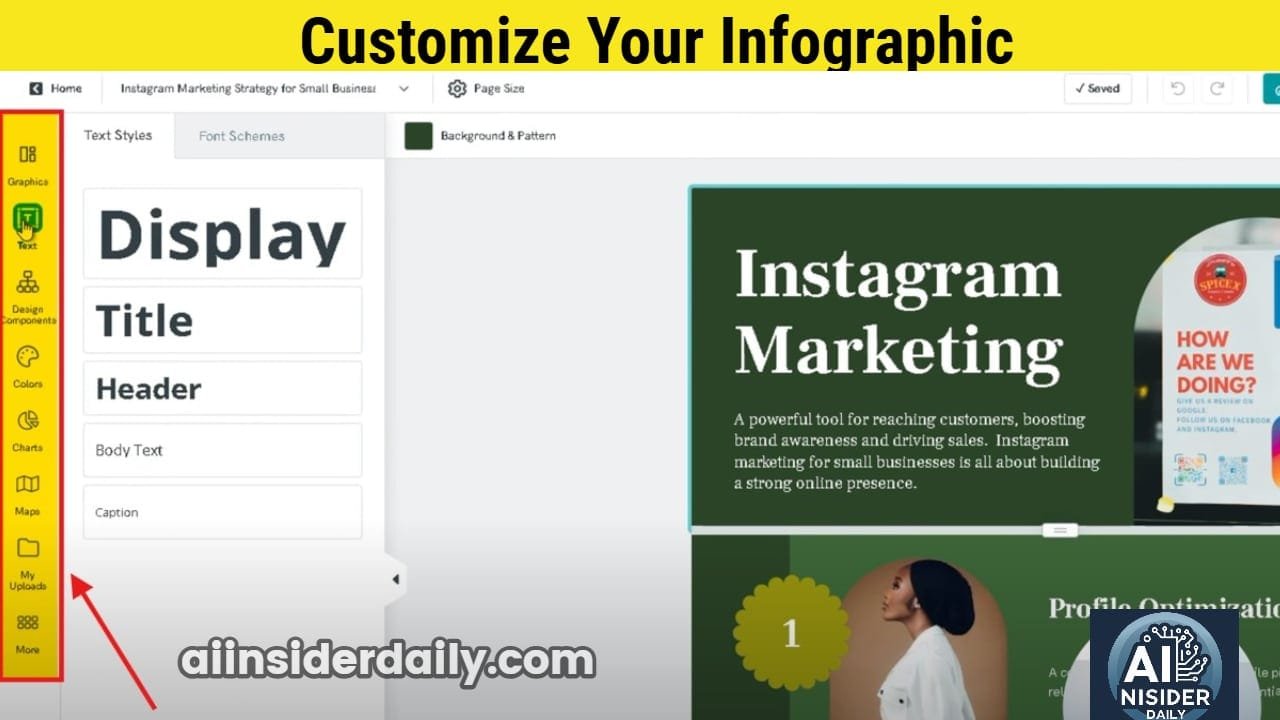
This is where you transform the AI-generated design into something truly unique. After clicking “Save and Edit,” you’ll enter Piktochart’s robust editing interface.
On the left side of the screen, you’ll find numerous editing tools:
Text Editing
- Click any text element twice to modify the content
- Use the text properties panel to change font, size, color, and alignment
- Add emphasis with bold, italic, or underline formatting
Image Replacement
- Click on any image you want to change
- On the right sidebar, click “Photos”
- Search for a more suitable image using keywords
- Drag and drop your chosen image onto the original
Adding Visual Elements
Explore these options in the left sidebar:
- Graphics: Add icons, shapes, and lines
- Charts: Insert data visualizations like bar charts or pie charts
- Maps: Include geographical representations
- Videos: Embed video content (though this won’t work for static LinkedIn posts)
- Illustrations: Add decorative elements
- 3D Graphics: Include three-dimensional visual elements
Color Scheme Adjustment
- Use the “Colors” option to modify the overall palette
- Ensure colors align with your brand guidelines
- Maintain good contrast for readability
Take your time with this step. The customization phase is what transforms a good infographic into a great one that truly reflects your personal brand.
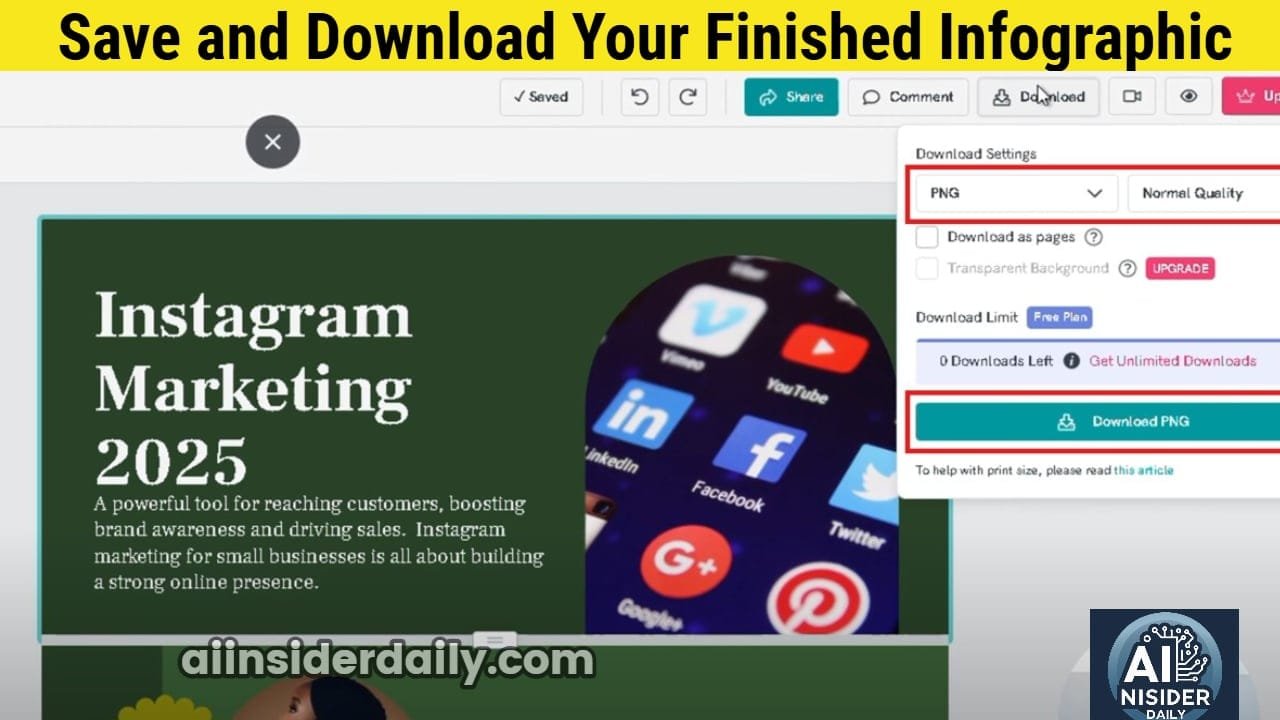
Step 11: Save and Download Your Finished Infographic
Once you’re satisfied with your customizations, it’s time to save and download your creation:
- Click the “Download” button in the upper-right corner
- Select your preferred format:
- PNG: Free option, good for web posting (recommended for LinkedIn)
- PDF: Requires paid plan, better for printing or sending
- PowerPoint: Requires paid plan, useful for presentations
For LinkedIn purposes, the free PNG option works perfectly. The image quality is excellent and optimized for digital viewing.
Step 12: Prepare Your LinkedIn Post
Now that you have your infographic downloaded, it’s time to prepare it for LinkedIn:
- Open LinkedIn and start a new post
- Click the “Add a photo” icon
- Upload your infographic PNG file
- Write a compelling caption that:
- Introduces the topic
- Mentions a key insight from the infographic
- Includes a call-to-action like “Swipe to zoom in” or “What’s your take on point #3?”
- Add relevant hashtags (3-5 is optimal) to increase discoverability
- Tag relevant connections or companies if appropriate
Step 13: Optimize Posting Time and Engagement
To maximize engagement, consider these LinkedIn best practices:
- Post timing: Tuesday through Thursday between 8am-2pm typically generates the highest engagement
- Follow-up: Respond promptly to comments to boost algorithm visibility
- Engagement boost: Ask colleagues to interact with your post in the first hour
- Analytics: Track which infographics perform best and replicate successful elements
💡 Recommended Watch:
Learn how to create eye-catching LinkedIn infographics using AI in just 13 simple steps. This video by PremTalks is a practical guide for beginners and pros alike—perfect if you want to boost your content with visual storytelling.
Advanced Tips for LinkedIn Infographic Success
Creating a Series of Related Infographics
Instead of one-off posts, consider creating a series of infographics around a central theme. For example, if you’re in marketing, you might create a weekly series called “Data-Driven Marketing Tips” where each infographic tackles a different aspect.
This approach:
- Establishes you as an authority
- Creates anticipation for your next post
- Provides consistent content for your profile
- Builds a recognizable visual brand
Repurposing Your Infographics
Get maximum mileage from your creations by repurposing them across platforms:
- Include them in your newsletter
- Add them to relevant blog posts
- Share them in industry-specific LinkedIn groups
- Feature them in your LinkedIn Articles
- Use sections as standalone images for Twitter/X
Creating Mobile-Optimized Infographics
Since approximately 57% of LinkedIn users access the platform via mobile, consider creating mobile-friendly infographics:
- Use vertical layouts (9:16 ratio works well)
- Ensure text is large enough to read on small screens
- Break complex infographics into carousel posts
- Test visibility on your own mobile device before posting
Common Mistakes to Avoid with AI-Generated Infographics
1. Information Overload
Just because the AI can fit a lot of text doesn’t mean it should. Edit ruthlessly to keep only the most essential points. A cluttered infographic loses impact.
2. Neglecting Brand Consistency
Always customize colors, fonts, and visual elements to match your personal or company brand. This consistency builds recognition over time.
3. Poor Contrast Ratios
Sometimes the AI generates beautiful but low-contrast designs. Always ensure text is clearly readable against backgrounds, especially for mobile viewers.
4. Forgetting Attribution
If your infographic includes statistics or data, always cite sources—even in small print at the bottom. This adds credibility and avoids plagiarism concerns.
5. Missing Call-to-Action
End your infographic with a clear next step for viewers: visit your website, download a resource, or connect with you directly.
Why AI-Generated Infographics Are Game-Changers for LinkedIn
Traditional infographic creation required either graphic design skills or budget to hire designers. This created a barrier that kept many professionals from leveraging visual content.
AI-powered tools like Piktochart democratize design by:
- Eliminating the steep learning curve of design software
- Removing the need for expensive design subscriptions
- Reducing creation time from hours to minutes
- Providing professional-quality templates and elements
- Offering data visualization capabilities without technical knowledge
These advantages make consistent visual content creation accessible to everyone—from solopreneurs to marketing teams at large corporations.
Case Study: How Consistent Infographics Boosted My LinkedIn Engagement
When I first started posting on LinkedIn, my text-only posts averaged about 500 views and minimal engagement. After implementing a weekly infographic strategy using the exact process outlined above, my average post reach increased to over 5,000 views, with some viral posts exceeding 50,000 impressions.
The key factors that contributed to this growth were:
- Visual differentiation in the feed
- Increased dwell time as people examined the graphics
- Higher share rates from connections
- Algorithm boost from higher engagement metrics
The best part? This entire transformation happened without any financial investment—just the strategic use of free AI tools like Piktochart.
If you’re exploring how AI can revolutionize crypto investing, be sure to read our full guide on how to use AI to invest in crypto for step-by-step strategies, tools, and expert tips
Conclusion: Start Your Infographic Journey Today
Creating professional infographics no longer requires design skills or expensive software. With AI-powered tools like Piktochart, you can transform your ideas or existing content into visually compelling infographics in minutes.
Follow the 13 steps outlined in this guide, and you’ll be well on your way to boosting your LinkedIn engagement with eye-catching visuals that position you as an authority in your field.
Remember that consistency is key—aim to publish infographics regularly rather than as one-off posts. This builds anticipation among your followers and establishes your visual brand over time.
So what are you waiting for? Head over to Piktochart today and create your first AI-generated infographic. Your LinkedIn profile (and your engagement metrics) will thank you!
Have you tried creating infographics for your LinkedIn profile? What topics would you visualize first? Share your thoughts in the comments below!


